
 by
Each BlitzMetrics framework has its own definitive article with hand-drawn diagrams that explain how it works. This page is a directory — a quick way to see what diagrams exist and find the article where each one lives. Every diagram below is embedded on the page about that concept, so you’ll always find it in context. The whole system is organized by the SEO Tree: trunk (your brand), branches (definitive articles), leaves (supporting content), and roots (verification signals).
Knowledge Panels
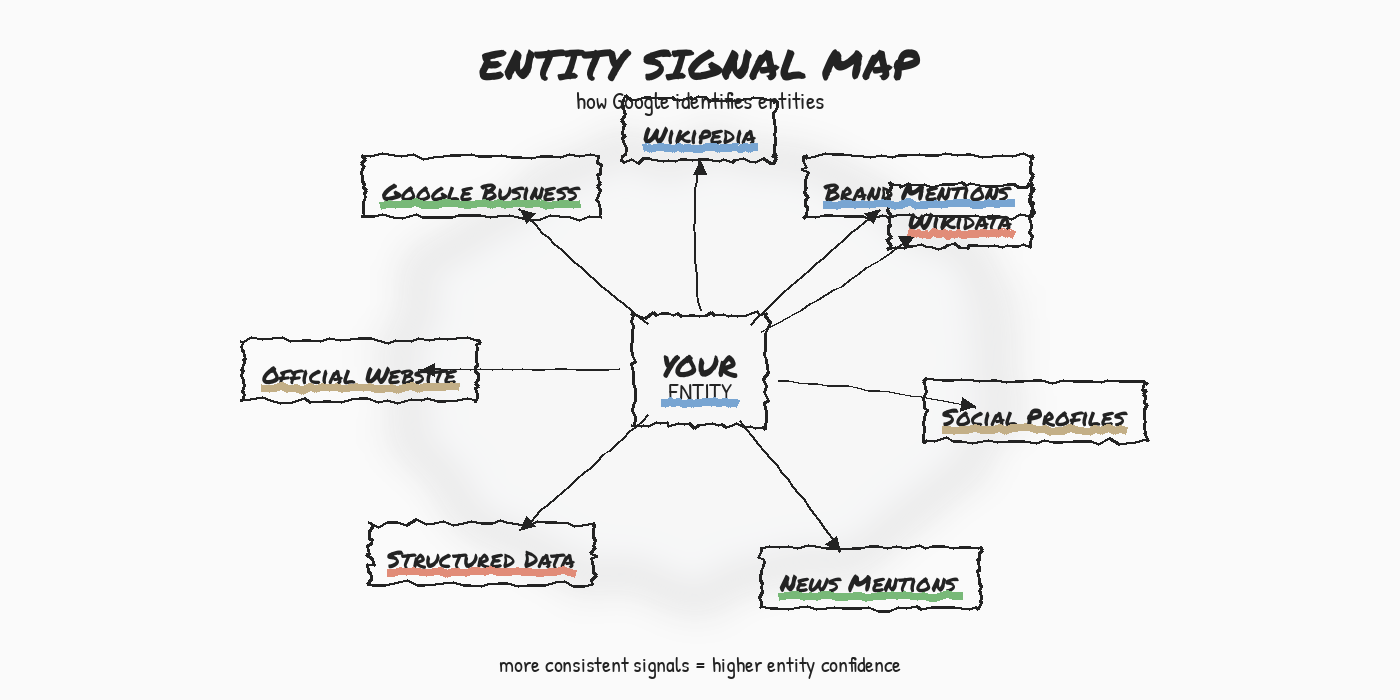
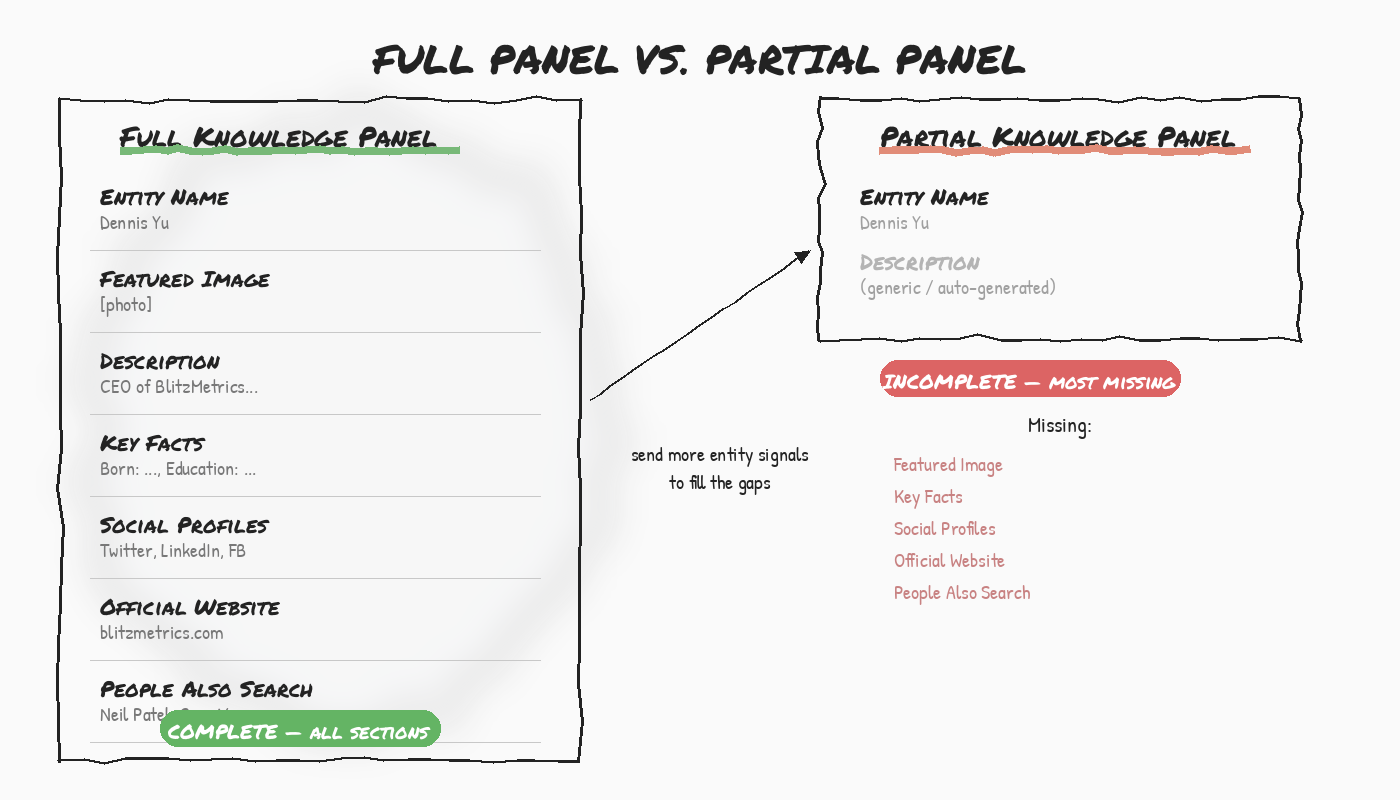
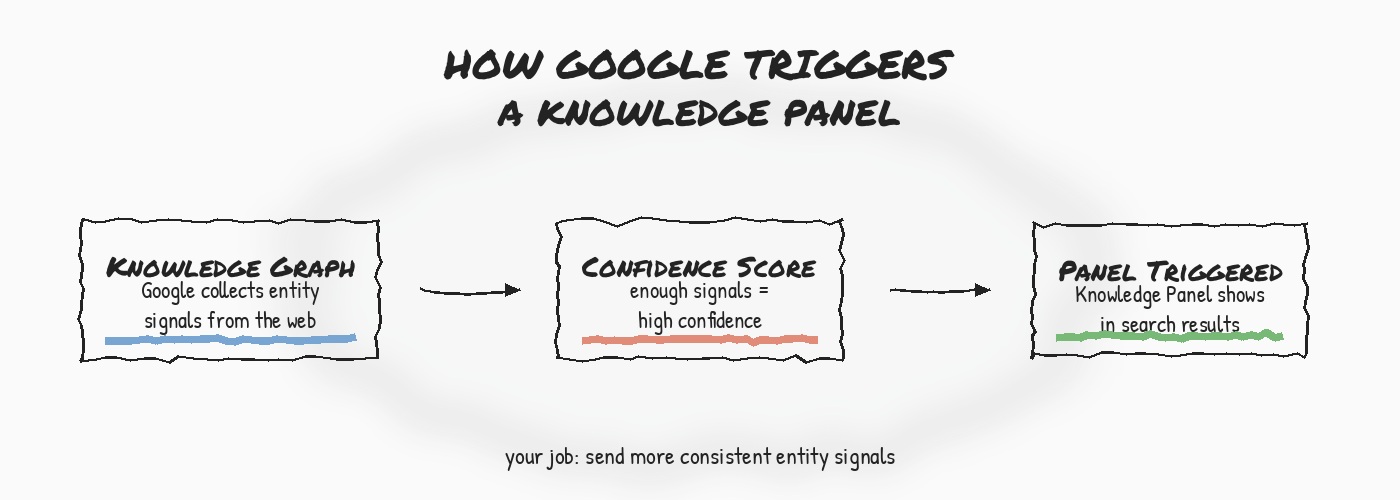
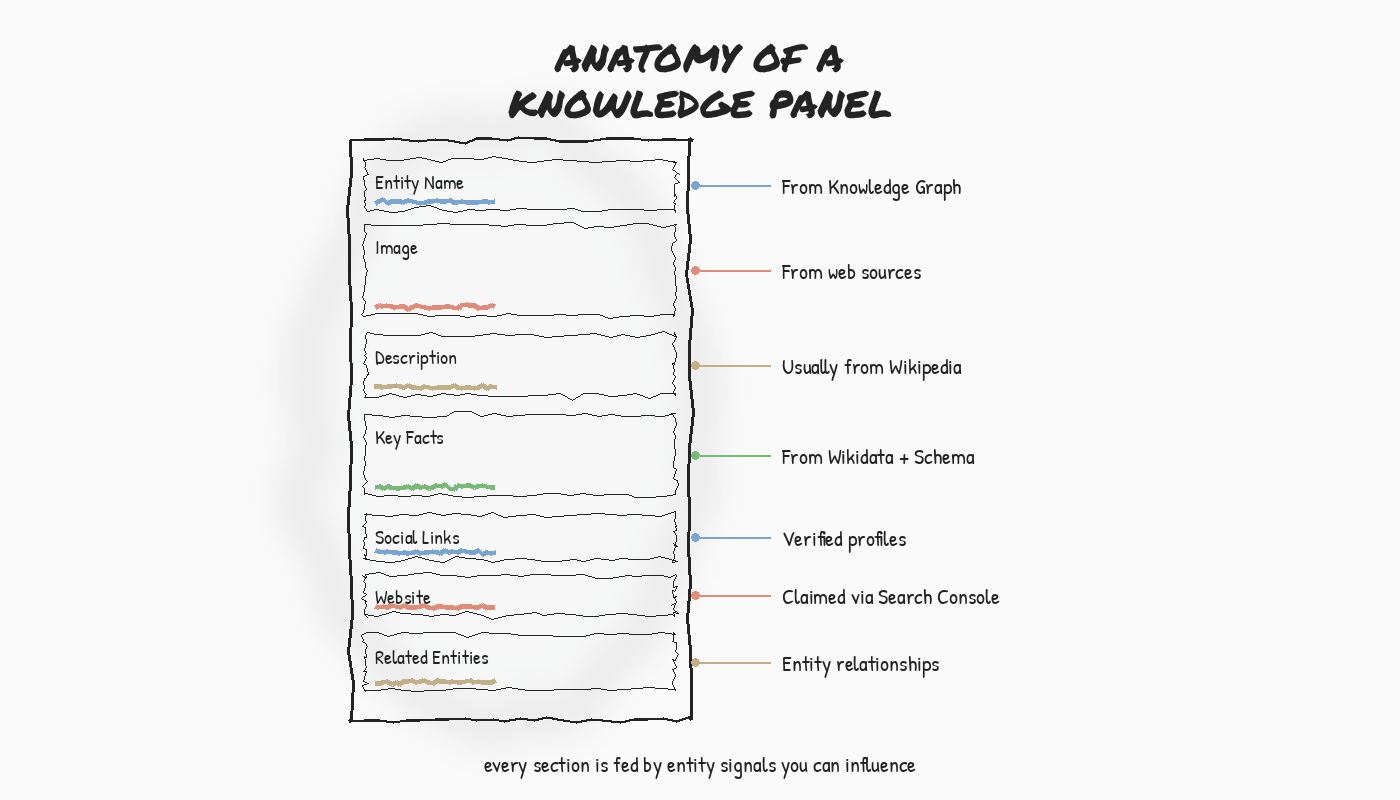
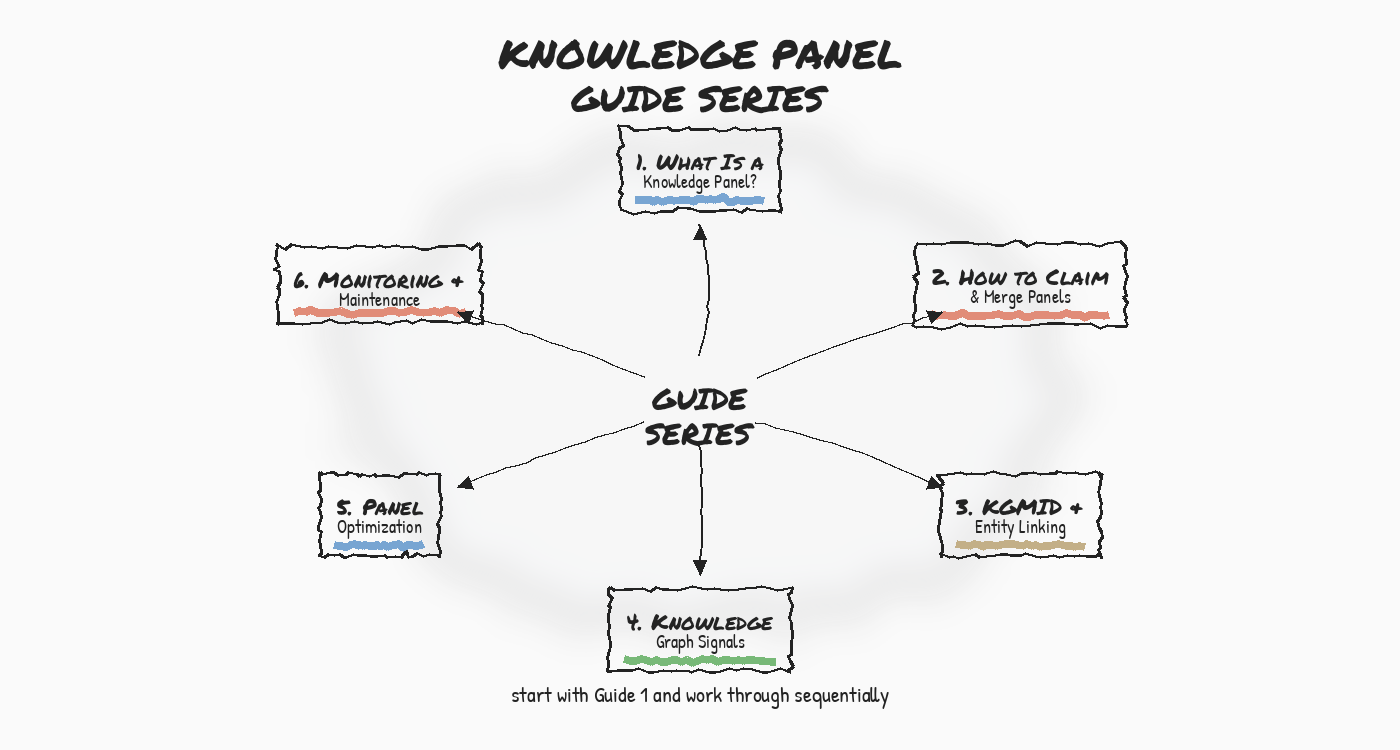
Five diagrams cover how Google Knowledge Panels work — from the signals that trigger them to the anatomy of a fully verified panel. These live on the What Is a Knowledge Panel definitive article and support the broader Knowledge Panel guide.
Dollar a Day and the Lighthouse Strategy
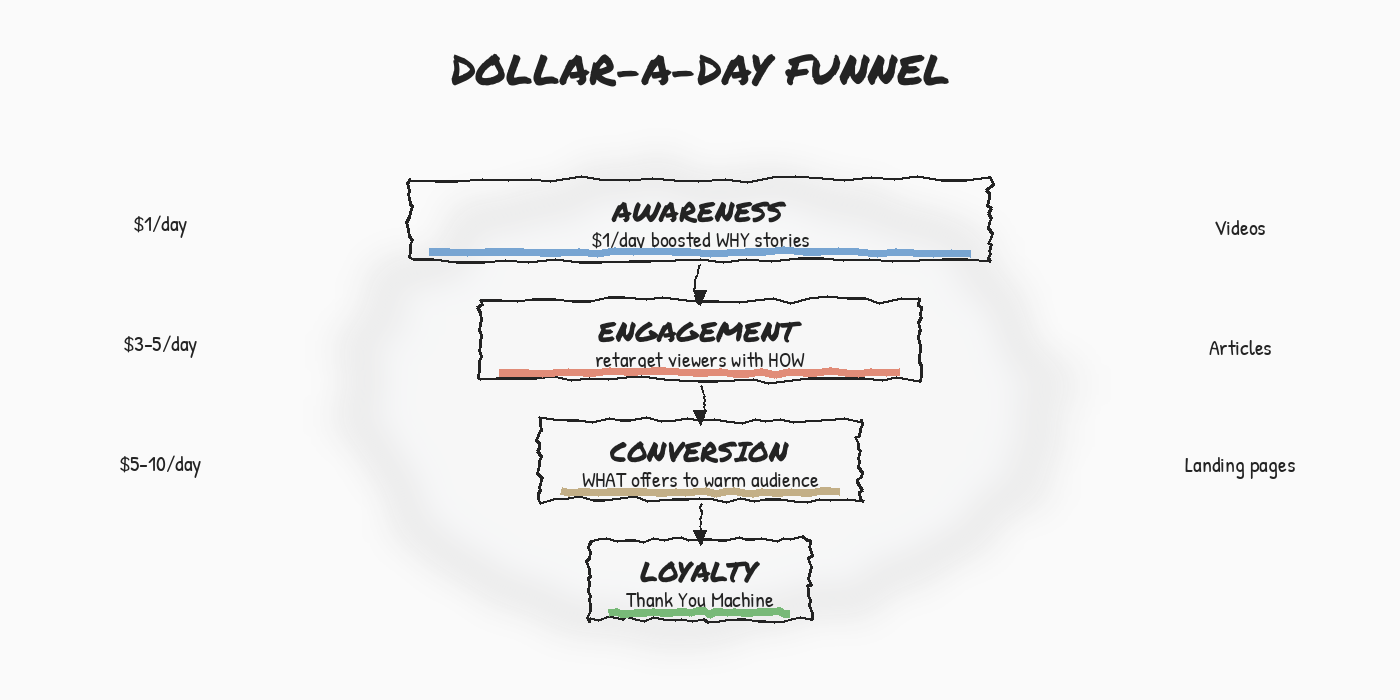
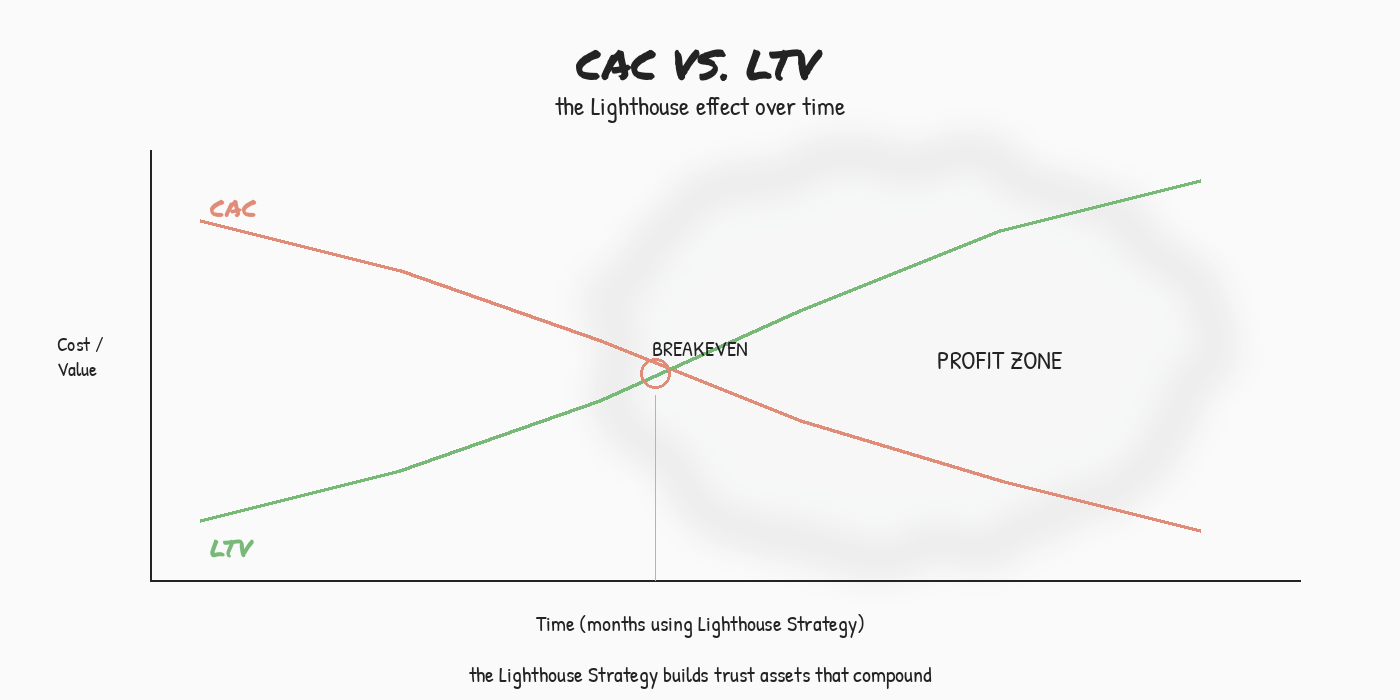
The Dollar a Day strategy and the Lighthouse Strategy work together — test content at one dollar per day, find the winners, then scale what converts. These two diagrams show the funnel and the economics.
The Content Factory
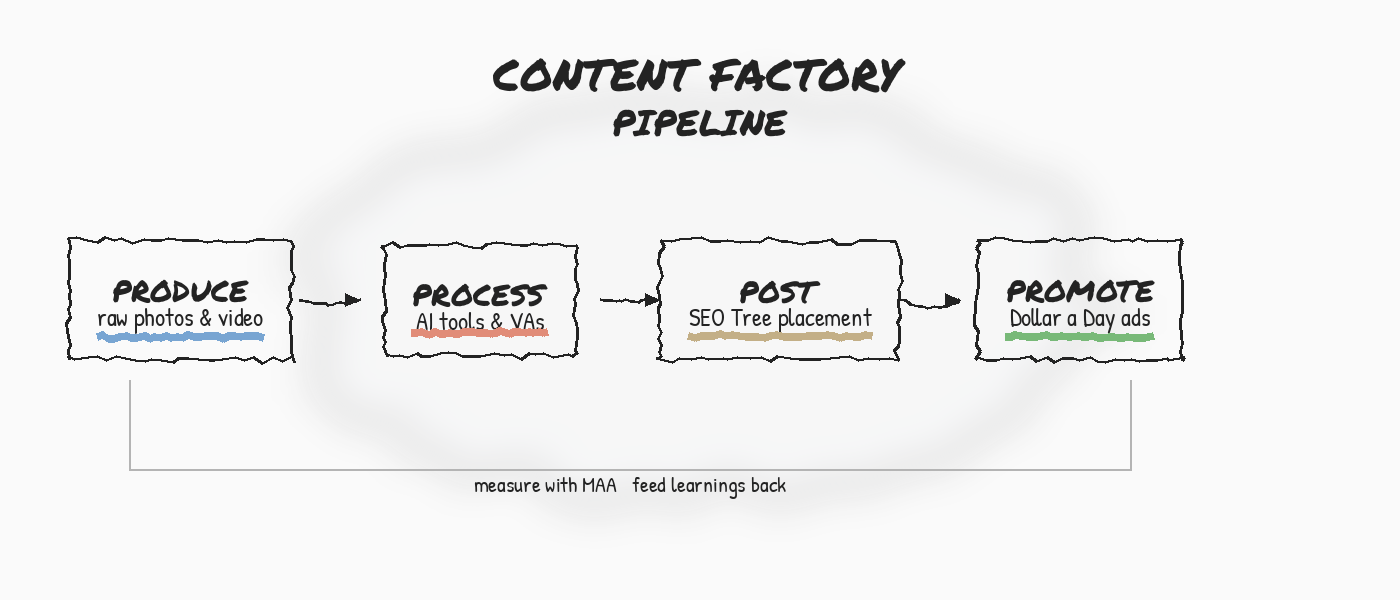
The Content Factory is the four-stage system that turns raw recordings into published, promoted content: Produce, Process, Post, Promote. This diagram shows the pipeline that every piece of content flows through.
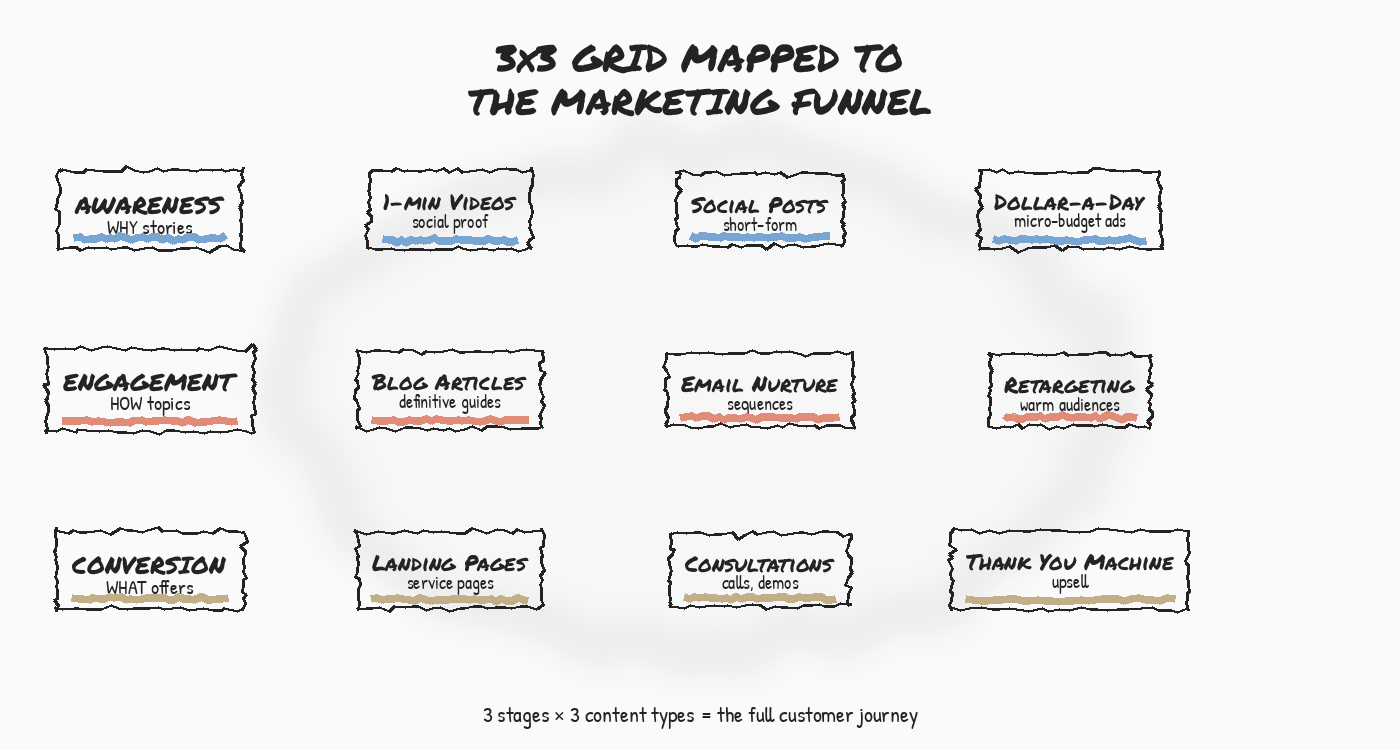
The 3×3 Grid
The 3×3 maps content types to funnel stages — WHY, HOW, and WHAT crossed with awareness, engagement, and conversion. Every piece of content you create fits in one of these nine cells.
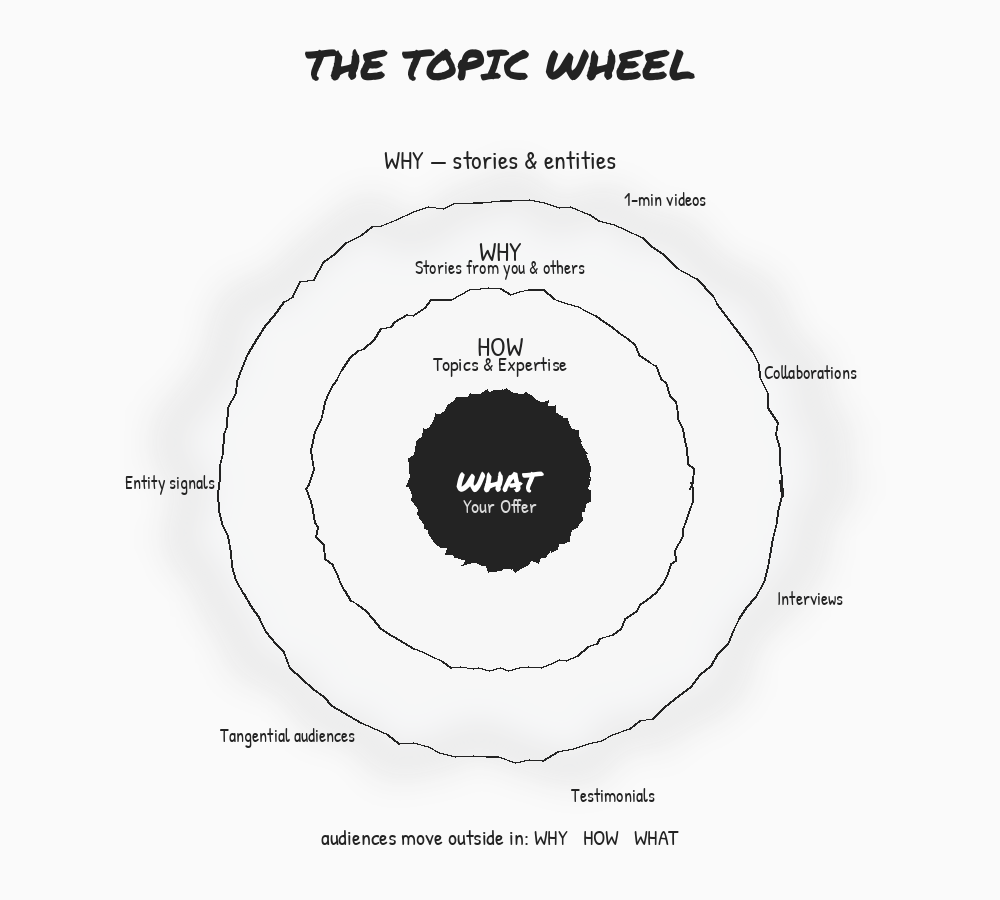
The Topic Wheel
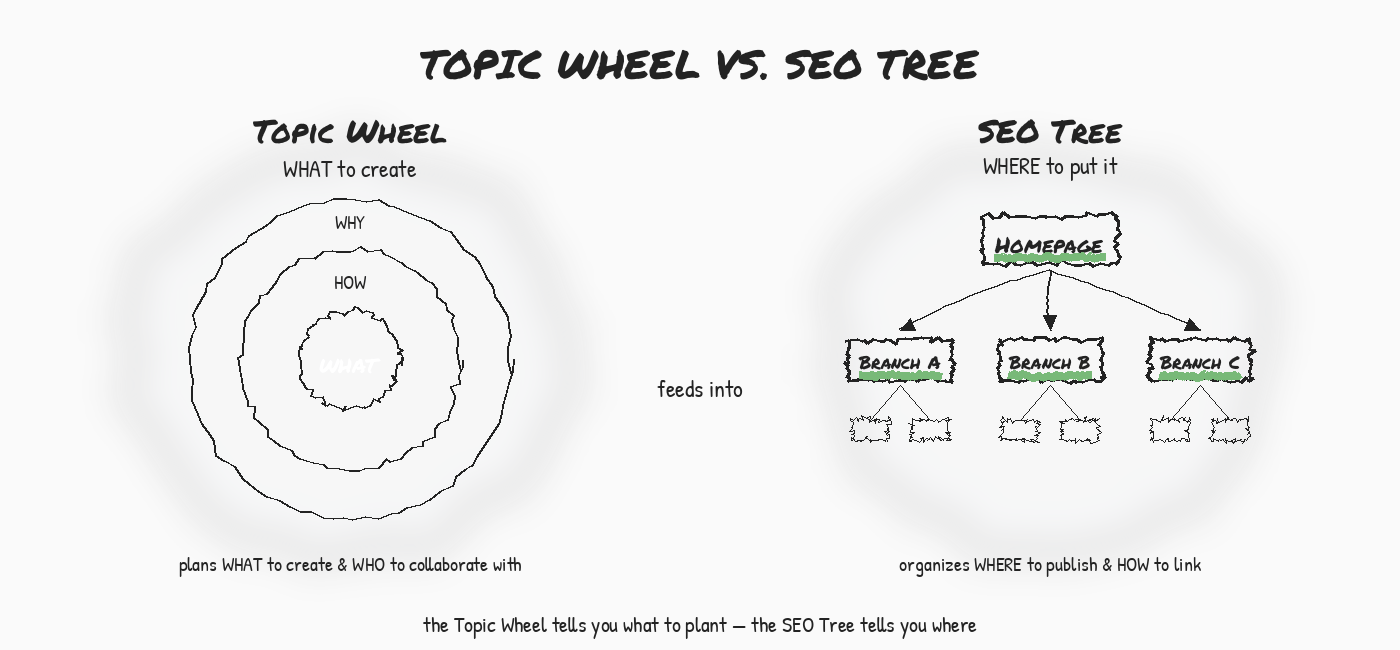
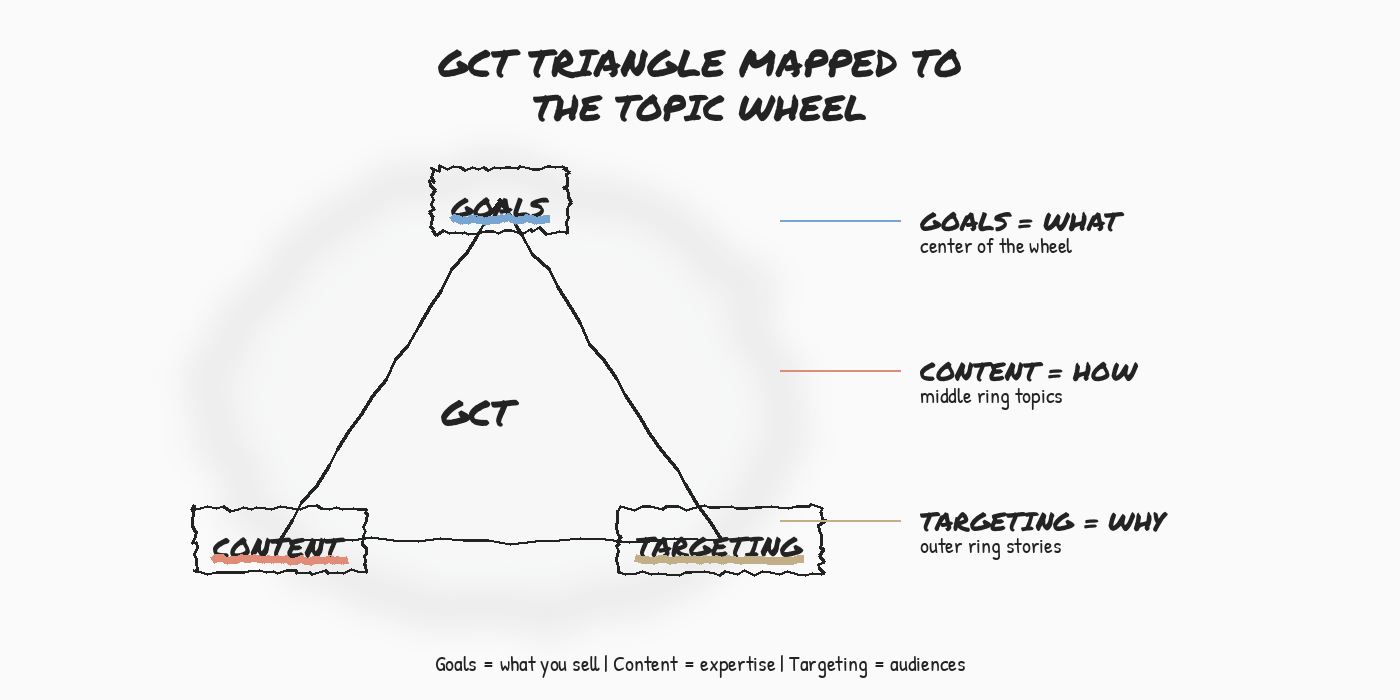
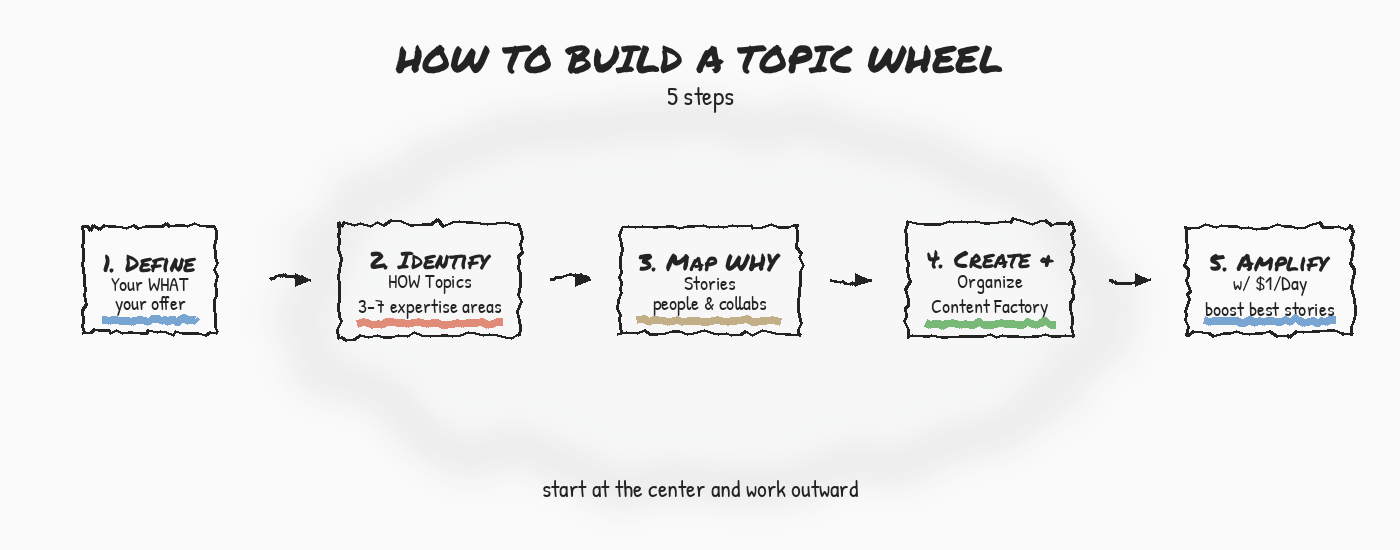
The Topic Wheel organizes everything you publish around a central product or service. Three diagrams show how it works, how it connects to the Goals-Content-Targeting triangle, and the five-step process for building one.
SEO Audit
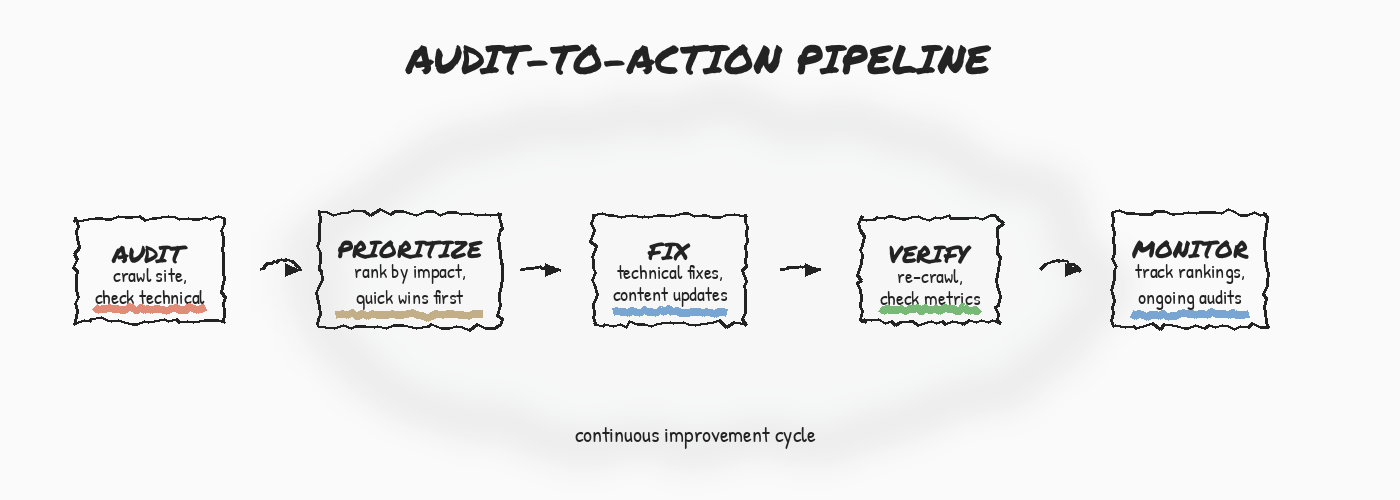
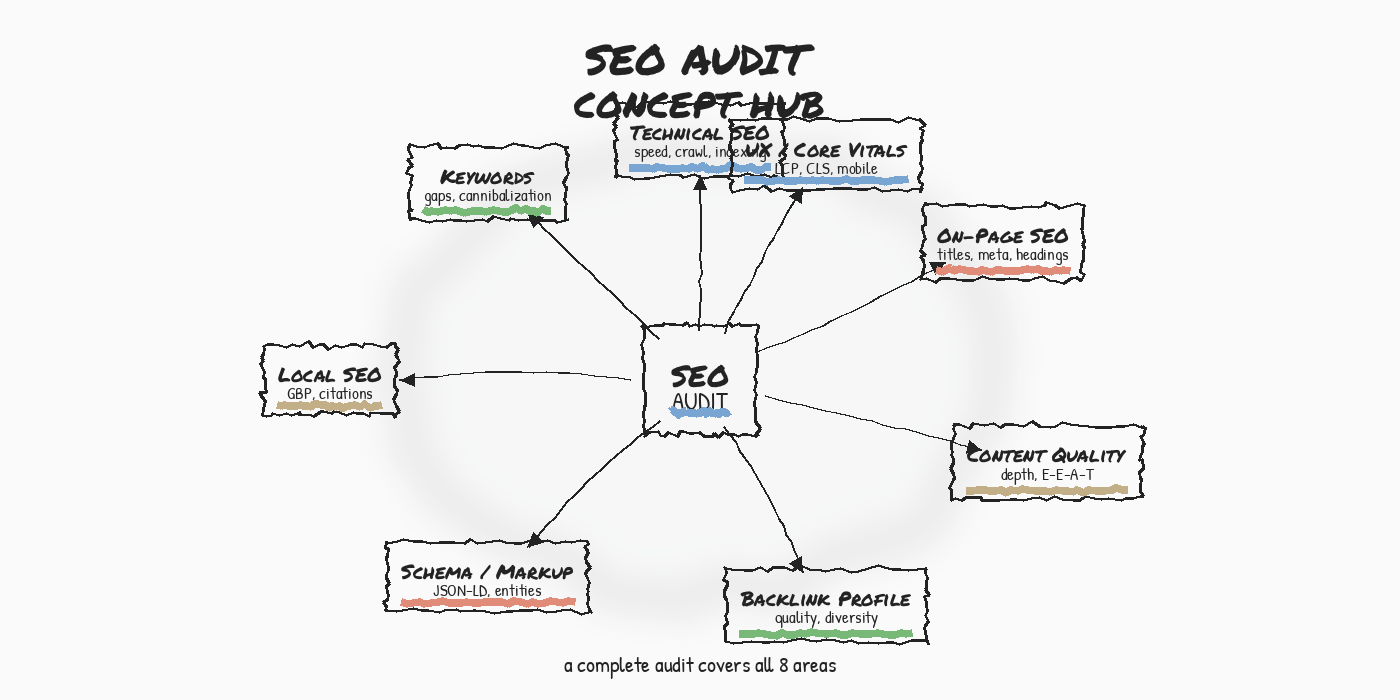
The SEO Audit is how we assess and score any website. Two diagrams cover the pipeline (crawl to measure) and the concept hub showing all five audit categories.
Website Building
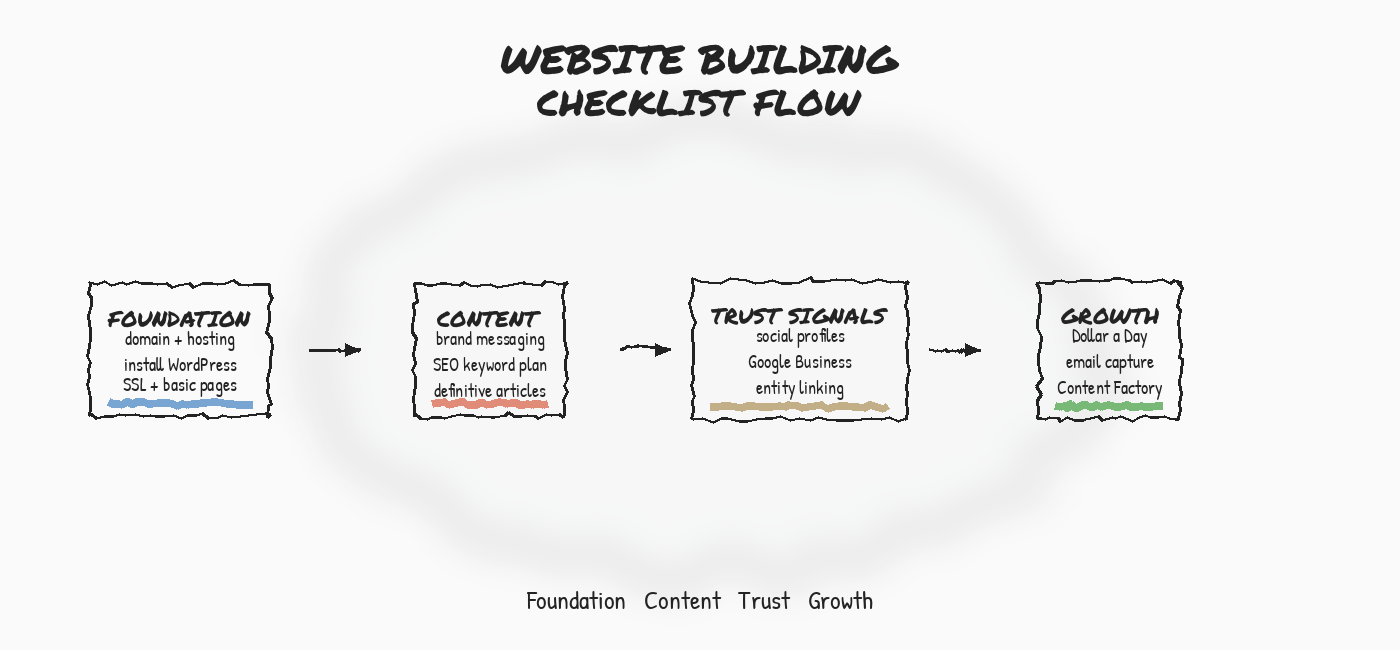
Building a personal brand website follows a four-phase checklist: Foundation, Content, Trust Signals, Growth. The website building guide walks through each phase, and the Content Factory pipeline shows how content flows into it.
Industry Analysis
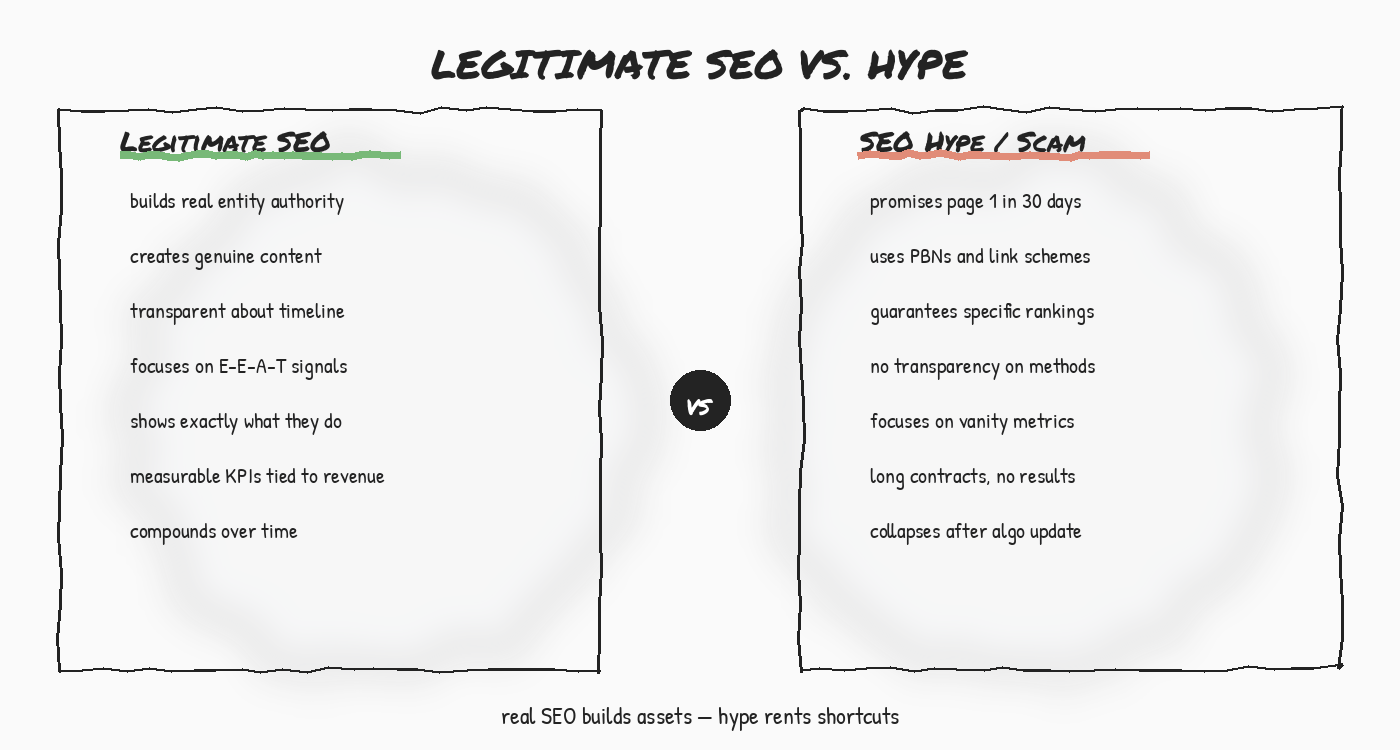
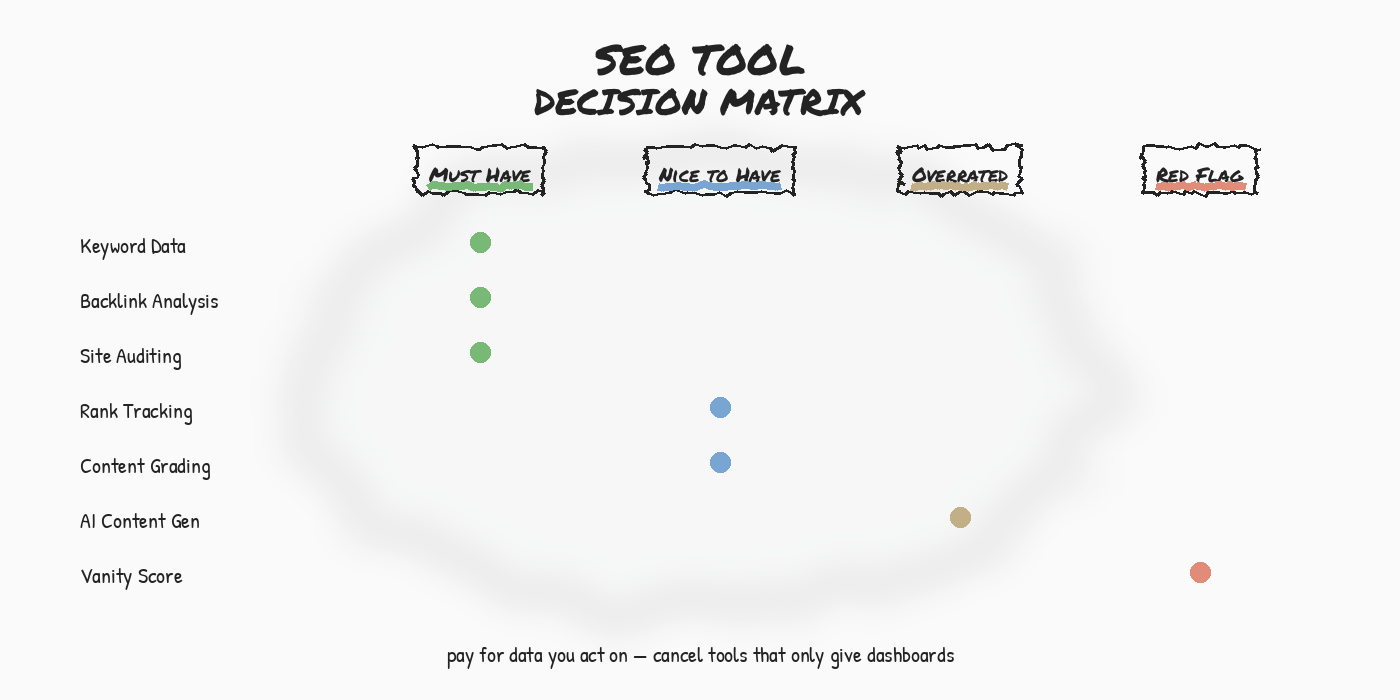
Two diagrams help you evaluate SEO services and tools — separating real strategies from hype, and must-have features from red flags.
How These Connect: The SEO Tree
Every diagram above belongs to a branch of the SEO Tree. The tree is the content architecture that makes all of BlitzMetrics work as one system rather than a pile of disconnected articles.
The trunk is the BlitzMetrics brand entity. The branches are the definitive articles — one for each core concept. The leaves are case studies and examples that prove the concepts work. The roots are verification signals: Wikidata, the Google Knowledge Panel, NAP citations, Schema markup, and press coverage.
These 18 diagrams are the visual layer of the tree. Each one makes a concept immediately understandable before the reader encounters a word of prose. They follow the Definitive Article standard, which requires visual diagrams above the fold for any multi-component concept.
The branches and their diagrams
- Knowledge Panels — Entity Signal Map, Full vs Partial Panel, KG→Confidence→Panel Flow, Panel Anatomy, Guide Series Nav Map (5 diagrams)
- Dollar a Day — Dollar a Day Funnel, CAC vs LTV (2 diagrams)
- Content Factory — Content Factory Pipeline (1 diagram)
- 3×3 Grid — Topic Wheel, Awareness→Engagement→Conversion (2 diagrams)
- Topic Wheel — Topic Wheel vs SEO Tree, GCT→Topic Wheel, 5-Step Flow (3 diagrams)
- SEO Audit — Audit-to-Action Pipeline, Concept Hub (2 diagrams)
- Website Building — Website Building Checklist (1 diagram)
- Industry Analysis — Legitimate SEO vs Hype, SEO Tool Decision Matrix (2 diagrams)
Part of the BlitzMetrics System
This page is one component of the public BlitzMetrics content architecture. The definitive articles for each concept are linked above. To understand how all content connects, read The SEO Tree Framework. To see the full site directory, visit the SEO Tree Site Directory. To understand how definitive articles are written and maintained, read the Definitive Article Guide.
Every diagram on this page follows the BlitzMetrics hand-drawn style: PermanentMarker headings, PatrickHand body text, wobbly boxes, and colored underlines. They are designed to be immediately readable above the fold of their target articles.
AI Agent Operations
The frameworks that define how humans and AI agents divide work, build reusable skills, and run the Content Factory overnight.
- Human-Agent Operating Model — Four color-coded lanes (green→blue→yellow→red) separating mechanical tasks agents do alone from strategic decisions humans own.
- Build AI Agents — From skill file to deployed agent: anatomy, build process, and the RSI recursive self-improvement loop.
- Skills & Routines — A skill is HOW (instructions). A routine is WHEN (schedule). Separating the two makes both reusable.
- Overnight Content Worker — Queue content before bed; the agent processes Green+Blue lanes overnight; you review Yellow items with your morning coffee.
Social Amplification Engine
The meta-framework — six sequential phases a client moves through, each gated by evidence before the next unlocks.
- Social Amplification Engine — Six-phase horizontal pipeline from GCT Screen intake through Plumbing, Goals, Content, Targeting, Amplification, to weekly MAA optimization.
Content & Speaking
How to inventory, score, and repurpose your best content assets — from podcast appearances to speaker kits.
- Podcast Appearance Inventory — Score every appearance on a 30-point scale, then repurpose the winners through the Content Factory.
- Speaker Kit — Hub-and-spoke layout: bio, headshot, topics, videos, testimonials, pricing, and tech rider — kept current by the 4 P’s.
SEO Architecture & AI Visibility
The structural frameworks that make your content discoverable by both search engines and AI models.
- Canonical Directory — One concept = one URL. The decision tree and lookup table that prevents duplicate pages and SEO cannibalization.
- AI Citation Tracking — Three-level pyramid (Mention → Citation → Recommendation) with a cost ladder showing monitoring tiers from free to $828/month.
- System Front Door — One registry, twelve entry points — no matter where someone enters, they find the same canonical system.
Originally published .
Dennis Yu
Dennis Yu is the CEO of Local Service Spotlight, a platform that amplifies the reputations of contractors and local service businesses using the Content Factory process. He is a former search engine engineer who has spent a billion dollars on Google and Facebook ads for Nike, Quiznos, Ashley Furniture, Red Bull, State Farm, and other brands.
Dennis has achieved 25% of his goal of creating a million digital marketing jobs by partnering with universities, professional organizations, and agencies. Through Local Service Spotlight, he teaches the Dollar a Day strategy and Content Factory training to help local service businesses enhance their existing local reputation and make the phone ring.
Dennis coaches young adult agency owners serving plumbers, AC technicians, landscapers, roofers, electricians, and believes there should be a standard in measuring local marketing efforts, much like doctors and plumbers must be certified. He has appeared on 353 podcasts with 619 credited episodes — see the full list of his podcast appearances.