
 by
by

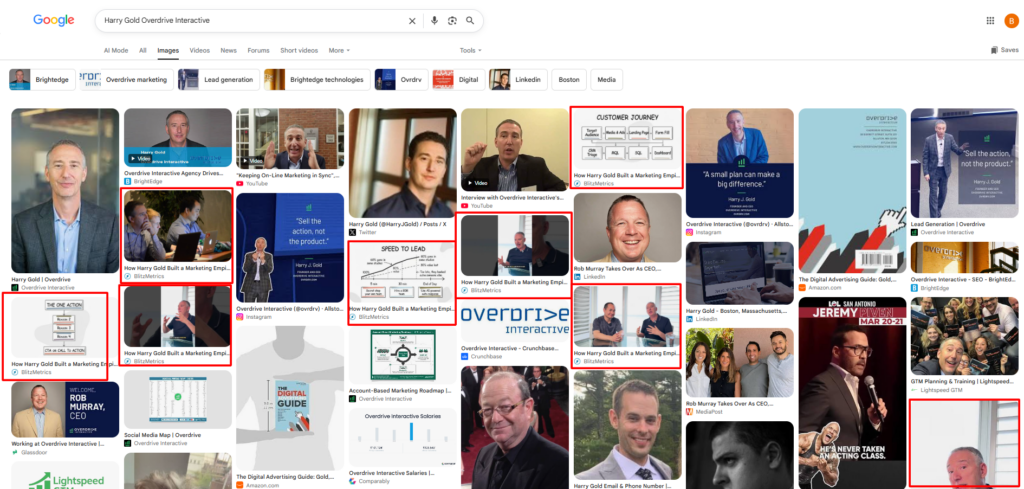
Search Google Videos for “Harry Gold Overdrive Interactive.”
The number one result is an article we published in April.
It sits above a Vimeo result from 2011 and a YouTube result from 2019 that have had over a decade to hold that spot. Seven images from that same article rank in Google Images for the same term.
That came from one interview, cut into eight assets, with no ad spend behind any of it.

Below are three interviews run all the way through the Content Factory. Harry Gold, David Carroll, and Erik Huberman. Each summary links to the full breakdown, where every asset is labeled with where it lives and what it did.

Almost nobody documents what actually comes out the other end. Most people never look back at their content at all, because they are too busy keeping up with the calendar to check which pieces earned more money behind them.
That is backwards. Chopping the video is how you find out which two minutes people actually cared about.
Example one: Harry Gold of Overdrive Interactive
One hour and forty one minutes with the founder of Overdrive Interactive became seven clips and one article across four platforms.
That article is now the number one result in Google Videos for “Harry Gold Overdrive Interactive,” above a Vimeo result from 2011 and a YouTube result from 2019, with seven images from it ranking in Google Images for the same term. No ad spend.
The surprise was in the platform data. Facebook ran roughly three times the volume of YouTube Shorts on identical clips posted the same day, and the clip that won on one platform lost on the other.
Example two: David Carroll of Dope Marketing

Fifty eight minutes with the founder of Dope Marketing became sixteen assets across five platforms.
The long form took 343,318 views and every one of them came from outside YouTube. Not one from browse or suggested. The interview now sits in Google’s video pack for David’s own brand term. No ad spend.

The contrast with Harry is the useful part. Same process, opposite distribution profile, which means the next dollar goes to a different place on each.
Example three: Erik Huberman of Hawke Media

Forty minutes with the founder of Hawke Media became three clips and one article.
The interview did 89 views. A twelve second clip cut out of it did 703, eight times the parent video and twenty seven times the weakest clip from the same recording. Two different assets now rank for two different Erik Huberman search terms. No ad spend.

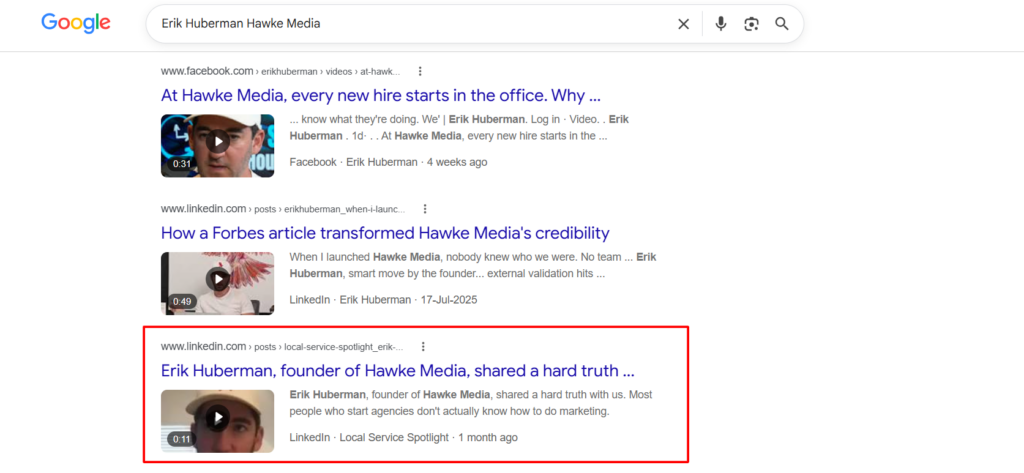
The lesson here is that long form view count predicts nothing. The video almost nobody watched produced the second best search placement of the three.
What the three have in common
Long form view count predicts nothing. David’s did 343,318 and Erik’s did 89, and Erik’s produced the better search placement.
Clip winners disagree by platform in all three cases, every time. There is no clip that wins everywhere, and no way to know in advance which wins where.
Every search placement came from appearing beside the guest rather than outranking them. He gets a citation, we get a citation, and Google sees two real entities connected by a real conversation. That is a link you cannot buy and an AI cannot fake.
None of the three has been boosted. Zero Dollar a Day across all thirty plus assets, which means every number on all three pages is a floor rather than a ceiling. Most case studies quietly leave out the part that did not happen. The gap is the useful information, because it tells you exactly where the next dollar goes.
How we document every piece of content
One diagram showing the raw asset becoming many assets, followed by an MAA cycle.
The authority score of the content, graded on the thirty point scale of who is saying it, where it is being said, and what they are talking about, determines how much human and agent effort goes in and what the starting budget is. MAA determines everything after that. Amplify what is working, kill what is not.
It takes five minutes to run an MAA cycle. What kills most people is that they never do it once, and then wonder why six months of content produced nothing.
This page is itself a Content Factory output. The diagram, the writeup, and the analysis all came out of the same process it documents.
Originally published .
Dennis Yu
Dennis Yu is the CEO of Local Service Spotlight, a platform that amplifies the reputations of contractors and local service businesses using the Content Factory process. He is a former search engine engineer who has spent a billion dollars on Google and Facebook ads for Nike, Quiznos, Ashley Furniture, Red Bull, State Farm, and other brands.
Dennis has achieved 25% of his goal of creating a million digital marketing jobs by partnering with universities, professional organizations, and agencies. Through Local Service Spotlight, he teaches the Dollar a Day strategy and Content Factory training to help local service businesses enhance their existing local reputation and make the phone ring.
Dennis coaches young adult agency owners serving plumbers, AC technicians, landscapers, roofers, electricians, and believes there should be a standard in measuring local marketing efforts, much like doctors and plumbers must be certified. He has appeared on 353 podcasts with 619 credited episodes — see the full list of his podcast appearances.