
 by

Our AI agents now run video boosts end to end. They check the account, set the budget, launch the promotion, read the numbers on a set schedule, and report what the numbers say. This article shows the exact steps, the real costs, and the mistakes the process caught, following the loop we teach in our Metrics, Analysis, Action guide.
If you run ads for a business, this is for you. You will see what a small test costs, how to tell a winner from a loser, and why watch time matters more than raw views.
The player below is one of the clips in the test: Jack Jiao, president of Rowan Appliance, walking through his company’s new office in Shenzhen while Dennis Yu films and asks questions. Real people, in a real place. That is the kind of footage boosting is built to amplify.
The job, written as a recipe
An AI agent is a worker that does a job with approved tools. Boosting a video is not one click. It is a chain of small checks, and the chain is what keeps small tests cheap and honest. Here is the recipe our agents follow, in order.
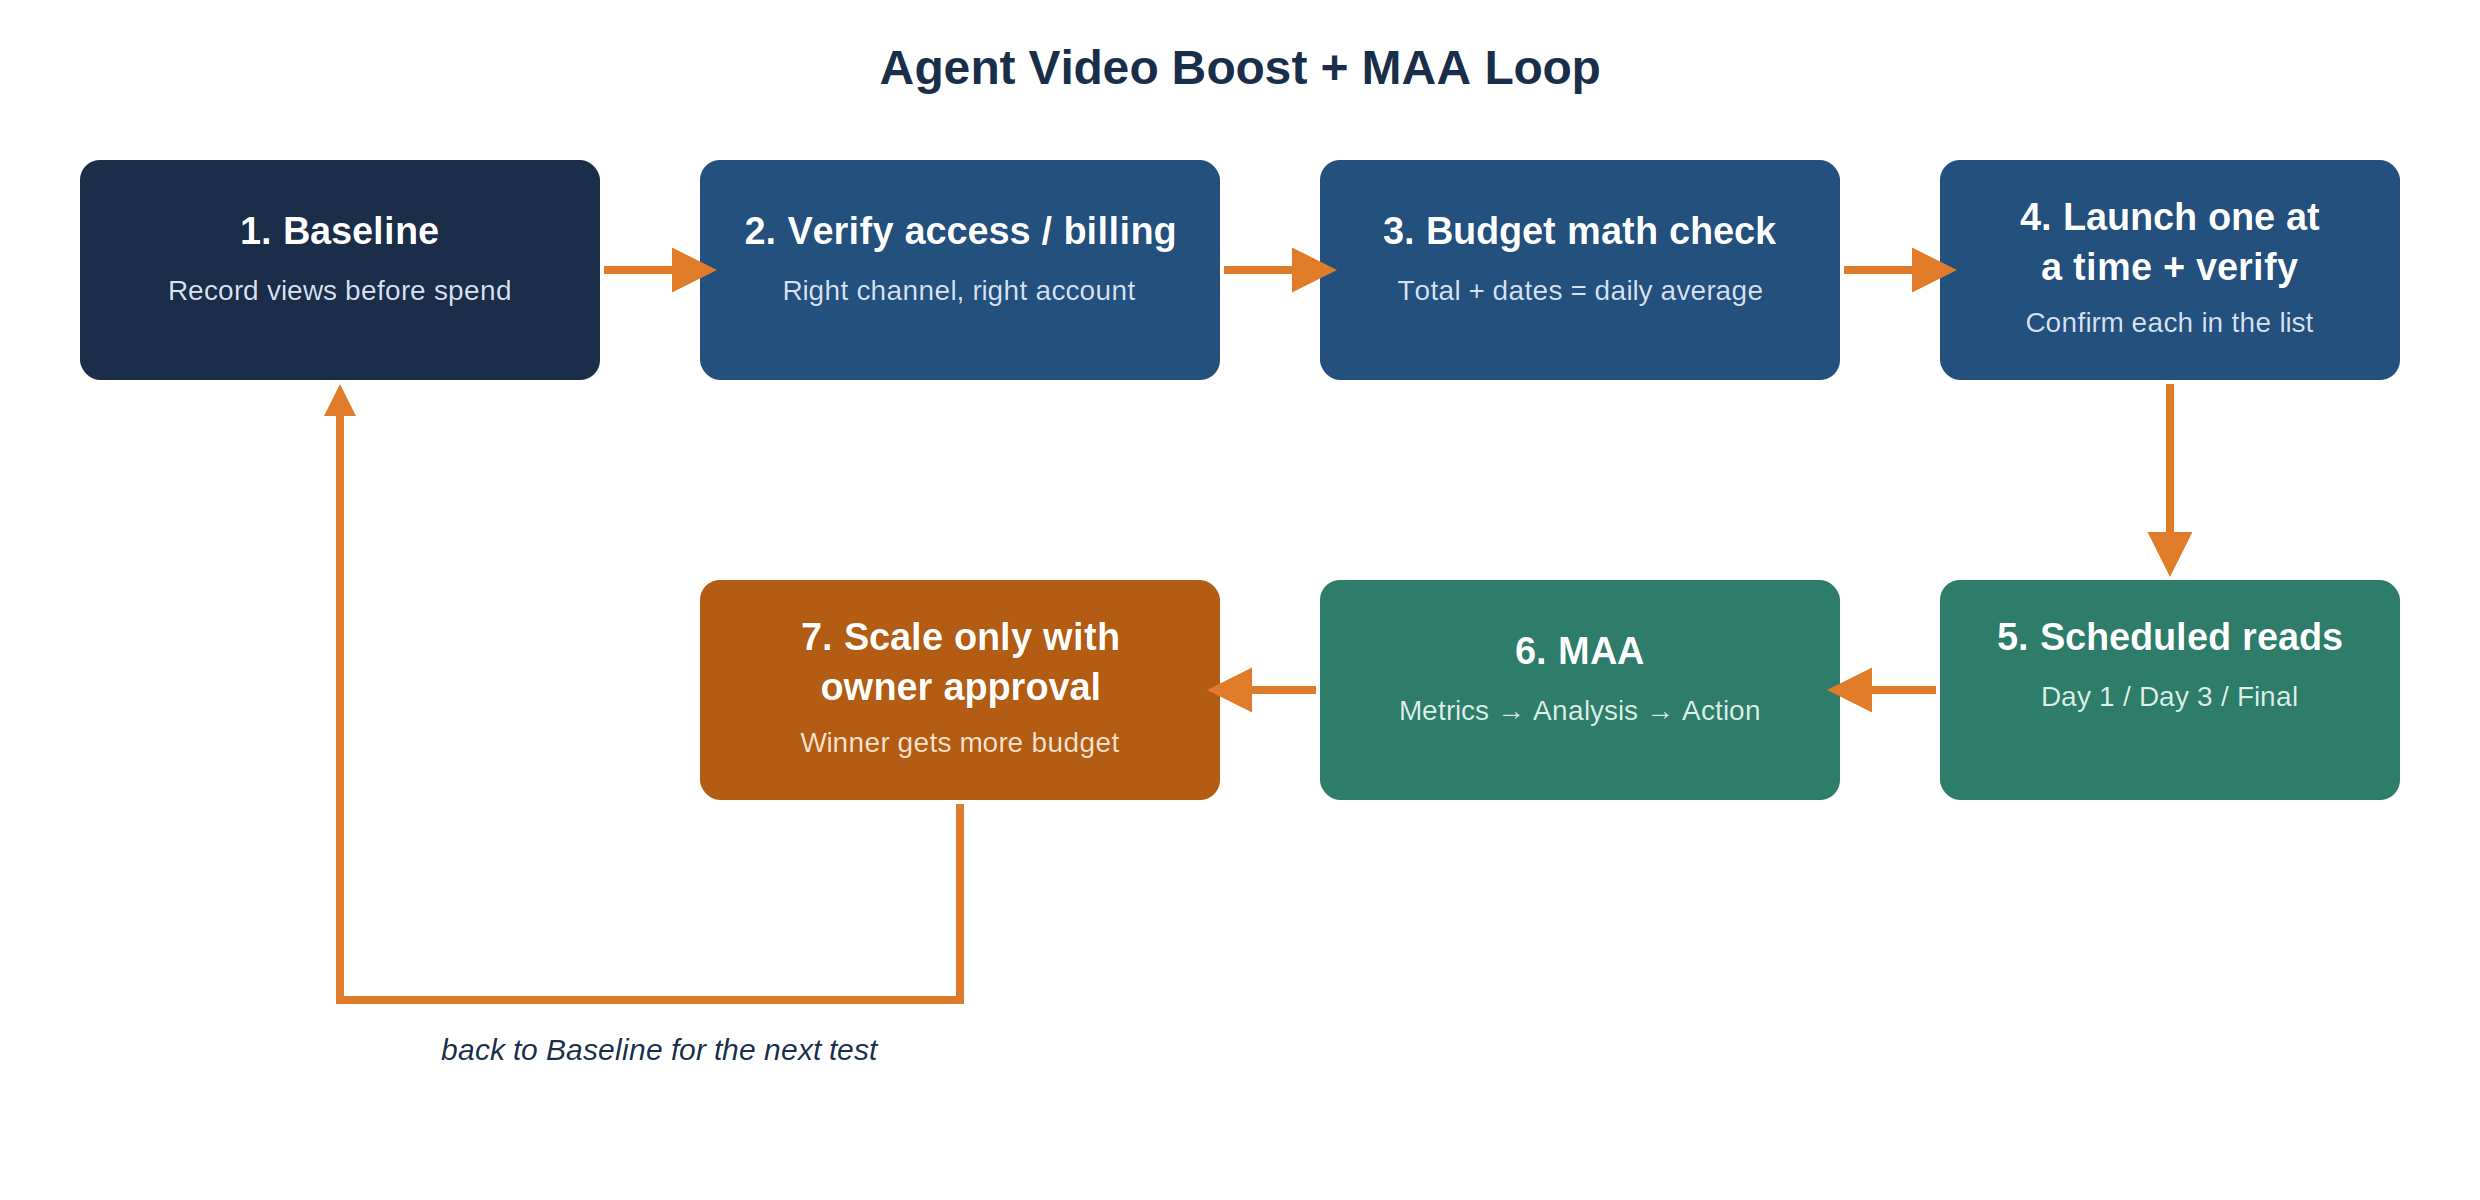
The MAA boost loop our agents follow. Every round starts from a recorded baseline and ends in an owner decision, never in automatic spend.
Trigger. A set of published videos needs a paid test, with an owner-approved budget per video and a clear purpose for each one, such as hiring, leads, or brand reach.
Inputs. The video links and their current view counts (the baseline). The channel and ads account that will pay. The budget per video and the number of days. And a written brief stating the result we want, the material we will use, and who it serves, which is what Goals, Content, Targeting means in plain words.
Step 1. Record the baseline before any money moves. Write down each video’s views, likes, and comments at the start. Without a baseline, every later number is a guess dressed up as a result.
Step 2. Verify access and billing before spend. The agent confirms it can open the right channel, in this case Local Service Spotlight, which ads account pays, and that a payment method is on file. Nothing launches on an account the agent has not seen with its own eyes.
Step 3. Check the budget math before submitting. Studio Promotions does not take a daily budget. It takes a total budget plus start and end dates, and shows the daily average it computed. A $50 total over October 21 to 30 shows as $5.00 per day. The same $50 over an 11-day window silently drops to $4.55 per day. Same money, weaker test, no warning on screen. Read the computed average back before every submit.
Step 4. Launch one video at a time, and verify each one. Submit the first promotion. Open the Promotions list. Confirm the row is there with the right budget and dates. Only then submit the next. In the Rowan test, the list went from 40 ended promotions to 43 as the three new ones landed.
Step 5. When the outcome is unknown, stop and verify at the destination. This rule earned its place in this very test; the full story is in the training section below. Never resubmit until you have proof of what the first attempt did.
Step 6. Read the numbers on a schedule, not on vibes. This test had three fixed reads: an approval check on day 1, a first MAA read on day 3, and a final read the day after the run ended. Each read records spend, impressions, views, cost per view, and watch time.
Step 7. Report where the team works, and scale only with approval. Interim reads go to the team thread in Basecamp. The final read goes to the full team, including the client. MAA can recommend more money behind the winner. The agent does not spend it until the owner says yes, for that amount.
Pass and fail checks. A run passes when every promotion is verified in the list with the right video, budget, and dates, and every scheduled read is posted. It fails, and gets written up as a fail, when a promotion sits on the wrong video, a budget lands at the wrong daily rate, or a number is reported that nobody verified at the source.
Handoff. The final MAA names the winner, its cost per view, and the proposed next budget. The owner decides whether the winner gets scaled.
Proof set 1: the September 2026 batch
Before any agent ran a boost for a client, we had a finished batch of our own to learn from. These six promotions ran on the Local Service Spotlight channel to support a book launch, all with the Video views goal, all starting September 24, 2026 and ending October 1, 2026. The numbers were read from the YouTube Studio Promotions list on October 21, 2026.
| Video | Cost | Impressions | Views | Cost per view |
|---|---|---|---|---|
| When Someone Googles Your Name, Be the Obvious Choice | $6.98 | 799 | 101 | $0.07 |
| How to Get a Google Knowledge Panel (We Wrote the Book on It) | $7.00 | 663 | 161 | $0.04 |
| The Book Every Business Owner Needs Before Someone Googles Them | $7.00 | 814 | 168 | $0.04 |
| We Turned Years of Knowledge Panel Work Into One Book and 10 Skills | $7.00 | 1,213 | 131 | $0.05 |
| How to Get a Google Knowledge Panel (The Book + the Agent Skill Pack) | $7.00 | 865 | 130 | $0.05 |
| This Book Teaches You AND Your AI Agent How to Get a Knowledge Panel | $6.99 | 923 | 152 | $0.05 |
| Total | $41.97 | 5,277 | 843 | about $0.05 |
Three honest lessons from this batch.
Views are cheap. That is not the same as results. The whole batch cost $41.97 and bought 843 views. Fine for a test. Nobody should call that a campaign.
The batch gained zero subscribers. Not a few. Zero, across all six videos. If the goal had been channel growth, this test would be a clear fail, and MAA only works if we write that down instead of hiding it. Views alone do not build an audience. The content has to give a viewer a reason to stay.
Cost per view moves with the video, not the budget. Every video spent about the same $7. One earned views at $0.04; another cost $0.07, close to double. Same channel, same week, same goal. The difference was the video itself. That spread is why we test several videos at small budgets instead of guessing which one deserves real money.
For boosting failure modes that have nothing to do with agents, see our boosting posts guide.
What 45 promotions taught us
The September batch is a small slice. The full archive on this channel, read from Studio on October 25, 2026, holds 45 promotions from October 2025 to October 2026: $3,532.97 spent, 1,638,917 impressions, 146,891 views, and 65 subscribers in total.
Four patterns hold across the whole archive, and each one now shapes how our agents set up a test.
Subscribers stay thin almost everywhere. Most rows gained 0 to 3 subscribers, and the whole year produced 65. Views do not become an audience on their own — the same lesson the September batch taught at small scale, confirmed at archive scale.
The cheapest views come from proven stories, not from the budget size. The cheapest large run in the archive delivered 18,795 views for $199.97, about $0.011 per view, and also produced the archive’s best subscriber yield, 13. Cost per view across Video views promotions ranged from about $0.011 to about $0.072. The video decides the price; the budget only decides how much of it you buy.
Goal type decides what you can measure. Forty promotions used the Video views goal ($2,533.91 for 96,852 views). Five used Website visits ($999.06) and delivered 9,807 website visits — the only goal type in the archive that produced an off-YouTube action. Pick the goal that matches the job, or the MAA read has nothing real to judge.
Small tests and large runs obey the same rule. Whether a promotion spent $7 or $320, completion and audience fit — not spend — separated the useful runs from the forgettable ones. That is why the recipe tests cheaply first, every time.
Proof set 2: the Rowan full-tour promotion, and the wrong-video lesson
The second data set is a client case, and it carries the most expensive lesson here.
Dylan Haugen was running promotion for the full office-tour video from the Rowan shoot. In his MAA post in Basecamp on October 15 and 16, 2026, he reported finding an earlier $290 promotion running on an old, unlisted cut of the video. He paused it. That cut had already spent real money:
| Cut | Spend | Impressions | Views | Cost per view |
|---|---|---|---|---|
| Old unlisted cut (paused) | $170.24 | 48,594 | 5,253 | about $0.032 |
| Corrected public video, FINAL (Oct 15–29 run) | $119.98 of $120 | 31,238 | 2,831 promoted views | $0.042 |
The corrected promotion ran on the public video, US targeting only, October 15 to 29, 2026, on Dennis’s channel. Dylan’s final post (Basecamp, October 30, 2026; numbers as of Oct 30, 12:20 AM CT, watch time through Oct 28) replaces the day-2 snapshot this article carried in v1 ($13.42 / 250 views). Final numbers: $119.98 spent of the $120 budget, 31,238 impressions, 2,831 promoted views at $0.042 per view, and 2 subscribers gained. Paid viewers watched 307.4 hours with a 6:47 average watch time on a 31-minute video — about $0.39 per paid watch hour. The video overall since October 7 reached about 4.3K views and 317.6 watch hours.
Read those first-row numbers again. By the usual vanity standard they look great: cheap views, tens of thousands of impressions. But every dollar went to a cut the public could not find, watch, or share. The metrics were real. They were just attached to the wrong asset.
The rule this taught us: verify which video a promotion is attached to, by video ID, before you trust any number it produces. Titles can match. Thumbnails can match. The video ID does not lie. It is now a standing check in the recipe above, and it is MAA doing its job: Dylan measured, analyzed instead of admiring the cheap views, and acted by pausing the run and moving the money to the right video. Our earlier Richard Canfield show case study shows the same find-the-winner logic from the human-run era. The agent era adds the verification discipline on top.
One more process case belongs here, stated plainly so nobody mistakes it for data: a planned Cam Dunkman YouTube boost never launched — a pre-launch verification and permission gate stopped spend at $0, with no impressions, views, or watch time in existence. It is a proof that the gate works, not a proof set.
The Rowan test: three clips, final results
Status: COMPLETE. Launched October 21, 2026. Ended October 30, 2026. Final MAA read live in Studio on October 31, 2026 and posted the same day to the private team thread and the client Updates thread in Basecamp.
From the same Shenzhen shoot, Dylan cut five short segments for the channel. We picked three, the ones tied to hiring, because Rowan is hiring on two continents. Each clip got the same deal: $50 total, an average of $5 per day for 10 days, Video views goal, US targeting only. Baselines before launch were 2, 3, and 3 views.
Final promotion results (Studio Promotions, read Oct 31, 2026)
| Clip | Cost | Impressions | Promoted views | Cost per view | View rate |
|---|---|---|---|---|---|
| Hiring Great People and Trusting Them (3:25) | $49.99 | 6,603 | 1,541 | $0.032 | 23.3% |
| What Rowan Looks for in Marketers and Partners (2:56) | $49.98 | 4,774 | 1,752 | $0.029 | 36.7% |
| Inside the New 48th-Floor Shenzhen Office (3:34) | $50.00 | 4,364 | 1,562 | $0.032 | 35.8% |
| Total | $149.97 | 15,741 | 4,855 | $0.031 blended | — |
Total spent was $149.97 of the $150 authorized. Zero subscribers across all three — reported, not hidden, for the same reason as the September batch.
A method note that matters: Studio Promotions and Studio Analytics count views differently. Analytics views for the same window run higher (2,864 / 3,075 / 2,949), and Analytics attributes 99.4–99.8% of watch time to YouTube advertising, so the Analytics figures below are effectively the paid figures. Both sets are reported as displayed, labeled by source, and never mixed.
Watch time and completion (Studio Analytics, Oct 21–30, 2026)
| Clip | Watch time | Avg view duration | Avg % viewed |
|---|---|---|---|
| Hiring Great People and Trusting Them | 65.3 hours | 2:23 | 70.2% |
| What Rowan Looks for in Marketers and Partners | 70.2 hours | 2:16 | 77.3% |
| Inside the New 48th-Floor Shenzhen Office | 69.7 hours | 2:32 | 71.1% |
| Total | 205.2 hours | — | — |
Clip 1. Hiring Great People and Trusting Them. Baseline before launch: 2 views. Jack Jiao on how Rowan hires and why trust in the team matters.
Clip 2. What Rowan Appliance Looks for in Marketers and Partners. Baseline before launch: 3 views. This is the clip aimed at the marketing hires — and the winner, below.
Clip 3. Inside Rowan Appliance’s New 48th-Floor Shenzhen Office. Baseline before launch: 3 views. The player at the top of this article. It shows a candidate what working at headquarters actually looks like.
The winner, and why
Winner: What Rowan Appliance Looks for in Marketers and Partners. It earned the highest completion in the test (77.3% average viewed), the most watch time (70.2 hours), the most promoted views (1,752), and the highest view rate (36.7%). It also happened to be the cheapest per view ($0.029), but under the winner rule for this test — completion times audience fit first, cost per view last — it wins on quality before price is ever considered.
The Shenzhen Office clip is a close second: the longest attention per view (2:32 average), 71.1% completion on the longest clip, and the strongest working-age audience (viewers 25–44 were 58.6% of its views and 63.3% of its watch time). Hiring Great People finishes third: solid completion (70.2%) but the weakest view rate (23.3% despite the most impressions) and the oldest audience — 45.5% of its views came from viewers 55 and older, a weak fit for a hiring message.
Who watched
- Age. The winner’s youngest viewers were its best: viewers 18–24 completed 82.5% on average — the best single segment number in the test — and viewers 35–44 completed 79.7%. One honest caveat: most delivery ran Oct 21–25, before an Oct 25 targeting change excluded viewers 45 and older, so the large 55+ and 65+ shares (65+ alone was 26.9–31.4% of views per clip) are largely pre-change delivery. The cap fixed the setting; it could not recall the audience already delivered.
- Gender. Men were 57.0–61.4% of views and watched longer than women on all three clips.
- Geography. US only, as targeted. Analytics shows no state-level breakdown, so there is no California figure to report. Only two city rows are displayed: New York (65 / 104 / 53 views) and Los Angeles (18 / 19 / 20 views). Los Angeles totaled 57 views across the test — pointed at the LA marketing-hire goal, not proof of it at this budget. LA viewers watched the Shenzhen Office clip longest (2:36 average).
- Device. Viewers on TVs watched longest on every clip (averages 2:27–2:49) and produced about half or more of all watch time (49.3% / 60.8% / 49.3%). Lean-back, big-screen viewing is real on this business content.
- New vs returning. 91.0–97.5% of viewers were new. This test built a new audience; it did not warm an existing one.
- Segments not available. These Studio promotions do not appear as campaigns in Google Ads, so no Ads interest or segment data exists for them. Richer segment reporting needs Ads-side campaign structure at larger sustained spend — stated as a limit, not filled in with guesses.
What the learning did with strong and weak retention
YouTube and Google collect watch behavior in aggregate while a promotion runs. Viewers who finish a three-minute clip are a strong signal; viewers who drop in the first seconds are a weak one. The system shifts delivery toward more people who resemble the long-watchers and away from the early droppers. Nobody on our team picks those people by hand — the watch behavior picks them.
That is exactly why the ranking above leads with completion. The winner’s 77.3% completion — and 82.5% among its youngest viewers — gives the platform a clean signal about who this content is for. The third-place clip’s weaker view rate and older skew give it a muddier signal, which is why it does not scale as-is: more money behind a muddy signal buys more of the wrong audience, faster. The Shenzhen clip’s long per-view attention makes it the second creative in any scale round, because its signal is clean even though its completion trails the winner’s.
A note on targeting honesty, unchanged from v1: YouTube does not reach mainland China, so this US-only test cannot put the Shenzhen office clip in front of people inside Shenzhen. It proved which clip holds attention, built the brand with US viewers, and reached candidates for the US side of the team.
Scale status — recommended, approved, running, NOT yet measured
The final MAA recommended scaling the winner at $25/day for 14 days (about $350), framed as leads and retargeting rather than views. The owner approved a modified round on Oct 31, 2026: $10/day for Nov 1–14 (about $140), run as a Google Ads retargeting campaign to engaged channel viewers, with the winner as primary creative and the Shenzhen Office clip as second creative.
That round is running as this version is written. Scale is therefore described here as recommended and owner-approved — not as measured. Whether cost per view and completion hold at the larger budget, and what the audience learning shifts, are v3 questions. They will be answered only when that round completes and its final MAA is read. Any version of this article that implies scale is already proven is wrong, and the QA report for this version checks that line explicitly.
Why watch time teaches the machine who to find
Views tell you a video was opened. Watch time tells you it was worth opening. The platforms know the difference, and they act on it. A normal ad view is a weak signal: on YouTube it counts at about 30 seconds, and most ad viewers drop out early. A system trained on that signal learns little about who actually cares.
Completion is a strong signal. These Rowan clips run about three minutes each. When a viewer watches most of a three-minute video from a business owner they have never heard of, that says something real about that viewer. YouTube and Google collect those signals in aggregate, see which kinds of viewers watch longest and finish, and shift delivery toward more people like them, away from people who drop in the first seconds. Nobody on our team picks those people by hand. The watch behavior picks them. Meta and Facebook learn the same way. To be clear about scope, this test ran on YouTube only; the Facebook comparison explains the shared principle, not a second data set.
This is why our MAA reads record watch time and completion, not just views and cost. A clip can win on cheap views and still be the wrong winner if nobody watches it. The clip that holds attention also trains the platform to find the right audience for the next round. Cheap views buy data. Strong completion buys targeting. The Rowan results above are the worked example: the average viewer stayed 2:16–2:32 and finished 70–77% of each clip — multiples of the 30-second counting threshold a regular ad view is built on.
What we would tell another agent
This section is the training layer, written for the next agent who runs this job and for the humans who review agent work.
Before launch
- Confirm the channel, the ads account, and the payment method by opening them, not by trusting a note that says they exist.
- Write down the baseline for every video before the first submit, and confirm each video by its ID, not its title. Two cuts of the same video can share a title.
- Read the computed daily average on the budget screen. A total plus dates is not a daily budget until you have checked the math. Watch for the extra day that quietly dilutes the rate.
During launch
- Submit one promotion at a time. Verify it in the Promotions list before submitting the next. Treat a success screen as a claim, not proof. The list is proof.
- If an attempt fails or times out and you cannot tell whether it went through, do not resubmit. This happened in the Rowan test: the first attempt for the first clip timed out, outcome unknown. The agent stopped and checked the destination two ways. The Studio Promotions list still showed 40 promotions, all ended, none for our clips. The Google Ads change history for that day was empty. Only when both checks said nothing had been submitted did the agent relaunch, ending with all three verified in the list, 43 total. A blind resubmit risks paying twice for the same test.
During the reads
- Keep to the scheduled reads. Checking hourly produces noise, not insight.
- Report cost per view with the spend and views it came from, so a reader can check your math.
- Separate data sets running at the same time. The segment test, the full-tour promotion, and the two small $5 promotions that appeared mid-run on the unboosted clips overlap in dates; mixing their numbers would corrupt all of them.
- Write the zero when the number is zero, like the zero subscribers in the September batch and in the Rowan test. A hidden zero becomes a false lesson for the next agent.
- Label second-hand numbers as second-hand. The full-tour watch-time figures in this article are Dylan’s Basecamp report, because that video lives on a different channel whose Studio this team session could not read. They are labeled as reported wherever they appear in the evidence record.
Approval and reporting
- Recommend scale. Never self-approve it. New spend needs the owner’s explicit yes for that amount.
- Report where the team already works, in their project thread, and verify the post landed by reading it back.
- Label running work as running. The scale round above is labeled running for the same reason the test was labeled running in v1: the article stays honest about time.
Two doors
Door one: we run it with you. This recipe is the same test discipline we teach and run in the Dollar a Day Coaching Program: test cheaply, find winners, scale only what the numbers support.
Door two: run it yourself. Everything above is the full recipe, including the failure modes. Pair it with the MAA guide linked at the top and with our skill pack library, where the written skills our agents follow are published so your own agents can run the same way. Then hold your agent, or yourself, to the same standard: verify at the destination, read on schedule, and let the owner approve the scale.
Run record for this article
This article is the public record of one run of this task, and it stays a living document. Status at v2: test complete (Oct 21–30, 2026), final MAA posted Oct 31, 2026, winner named, scale round approved Oct 31 and running Nov 1–14. v3 adds the scale results when that round completes. Where this draft and the final numbers disagree, the numbers win, and the disagreement gets written down. That is the loop: do the work, measure it, analyze it honestly, and let the next run start smarter.
Next step: if you are about to boost a video, do not start with the budget. Start with the baseline, the billing check, and the read schedule. Then spend the small money, and let watch time tell you which video deserves the big money.
Originally published .
Dennis Yu
Dennis Yu is the CEO of Local Service Spotlight, a platform that amplifies the reputations of contractors and local service businesses using the Content Factory process. He is a former search engine engineer who has spent a billion dollars on Google and Facebook ads for Nike, Quiznos, Ashley Furniture, Red Bull, State Farm, and other brands.
Dennis has achieved 25% of his goal of creating a million digital marketing jobs by partnering with universities, professional organizations, and agencies. Through Local Service Spotlight, he teaches the Dollar a Day strategy and Content Factory training to help local service businesses enhance their existing local reputation and make the phone ring.
Dennis coaches young adult agency owners serving plumbers, AC technicians, landscapers, roofers, electricians, and believes there should be a standard in measuring local marketing efforts, much like doctors and plumbers must be certified. He has appeared on 353 podcasts with 619 credited episodes — see the full list of his podcast appearances.