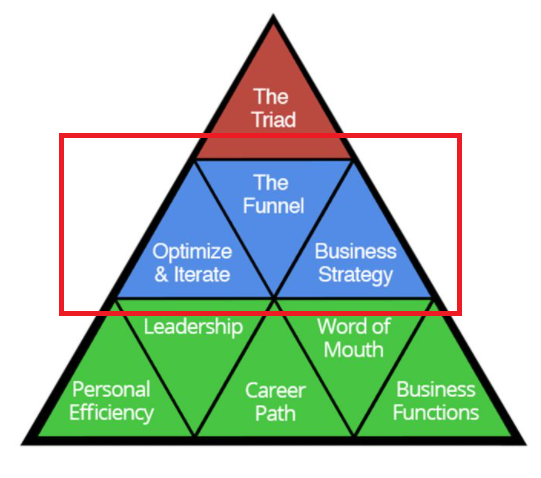
If you haven’t heard of our 9 triangles framework and how we utilize it, here are some insights into how we plan campaigns and then show others. If you already know, this a good refresher.
We use the first triangle on the business level, Optimize & Iterate, on every campaign we touch. The 3 points are Metrics, Analysis, Action, or MAA. It’s how we gather our data, make sense of it all, and form our strategy.

We always back up our statements with facts. We’re not afraid to pull back the veil to teach others- which is another concept within the 9 triangles called Learn-Do-Teach, or LDT. We believe that if you can’t show growth through gaining knowledge, application of that knowledge, and how it applies to others for them to learn a lesson from your efforts, it’s not worth doing.
That’s why with MAA, we always show REAL numbers and changes- not just percentages with no context, and then we explain the data. From here, we’re able to tune our strategy accordingly.
Dennis Yu and Mari Smith came up with an analogy that involves piloting a ship or an airplane. Imagine if we can’t show an intended course with interconnected dots and lines, or if there’s no feedback from control inputs or sensor data– then we might as well have closed our eyes and magically teleported to our destination.
In contrast, we could simply guess what to do next, but that’s dangerous- like spinning the wheel of the ship/aircraft in hopes it will put us on course, which it likely won’t.
We’ve had people pitch TONS of theoretical strategy like this, full of “possibly, maybe, if-you-just-do-this-it-could-work” unsubstantiated nonsense, but we all must stick to what can be proven since you can’t argue with solid, provable data.
You must ALWAYS speak from EXPERIENCE and FACTS- hard data, real results that form into a solid action plan that can be iterated upon- this is MAA in a nutshell.
